Nature in cycles 2013-04-22
Let's look at a graph of suface mass balance reflecting precipitation.

Earlier it had been stated: Climate model projections based on increasing greenhouse gas concentrations predict a warmer atmosphere containing higher levels of water vapour, suggesting that the Antarctic snowfall is expected to increase. Thus, the SMB of the AIS will negatively contribute to sea level rise (AIS= Antarctic Ice Sheet)
It is said that it may contribute to a sinking ocean surface. If it will be so there should not be too many icebergs that calve into the sea.
According to the article: Recent satellite observations indicate an accelerating ice loss in these peripheral areas due to ongoing and past glacier acceleration, implying that the contribution of ice sheets to sea level rise increases over time.
It is proposed that there should be an increased calving of icebergs because that you have seen this recently. The author will not think cyclic.
The chart and calculations can be found in a recent article in the publication Cryosphere
http://www.the-cryosphere.net/7/303/2013/tc-7-303-2013.html
In another article, the total mass balance is now at the Antarctic
"within 1992–2005 lie in a narrowed range of +27 to -40 Gt/year, which is about 3% of the annual mass input and only 0.2 mm/year SLE. Our preferred estimate for 1992–2001 is -47 Gt/year for West Antarctica, +16 Gt/year for East Antarctica, and -31 Gt/year overall (+0.1 mm/year
SLE). http://icesat4.gsfc.nasa.gov/cryo_data/publications/Zwally-Giovinetto_SurveysInGeophysics_2011-1.pdf
So it is totally a negaiv mass balance at -31 gigatons representing a sea level increase of 1 cm in 100 years. But then we have not let go of the cyclic momentat in the calculations.
We'll just say that it is very difficult to fully calculate this ice. The above given data was to 2001. According to another publication, it changed to 2003. Similar analysis for Antarctica shows a positive balance of 38 Gt / yr for the period 2003 to 2008.
One of the main writers of those articles is a famous Antarctic Scientists named Zwally a NASA scientist. This then it becomes a sea level decrease of 0.1 mm / year that is 1 cm in 100 years. But we must not forget the cyclic.
http://adsabs.harvard.edu/abs/2011AGUFM.C42A..05Z
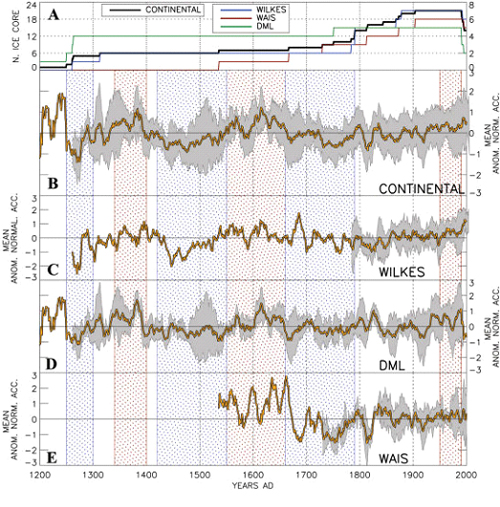
Fig. 4. Mean normalised anomalies of the annually resolved SMB time series at continental and regional scales obtained from the time ice core dataset, as described in the text. (A) Number of records from each year in the period from 1200 to 2000 used to calculate the continental (black line, left y-axis), WILKES, DML, and WAIS stacked records (black, blue, green and red lines, respectively, right y-axis). (B) Mean normalised anomalies of the SMB time series at the continental scale. (C) The DML mean normalised anomalies stacked record. (D) The WAIS mean normalised anomalies stacked record. (E) The WAIS mean normalised anomalies stacked record along with the ±1 uncertainty standard deviation (grey-filled contour around each stacked record). The blue- and redfilled rectangles represent periods with negative and positive SMBs at the continental scale, respectively, as described in the text.
In the diagram above you can see the calculations of surface mass balance in the different provinces of Antarctica. (WAIS = West Antarctic Ice Sheet)
ISSI say Antarctica will contribute to a havsytesänkning of 30 cm until the 2300th
In a publication from ISSI (a space research institute where our Swedish Lennart Bengtsson is a board member) in Bern, Switzerland, we find the following diagram where one tries to predict sea level rise and contribution from Greenland and Antarctica. The other glaciers mean so little so it is not included.
According to them, the Antarctic to contribute to sea level decrease, Grönlnad with sea level increase. In totality it will be a rise of 60 cm in 300 years. Then it will be sea level increase because water expands as it gets warmer. What they estimate that it will cause I have not found. If we would say a meter in 300 years, that I must say is a bit contrary to what some climate alarmists say. An increase of between 1-2 meters until 2100.
I told my students today that it's just something that they scare people with with.
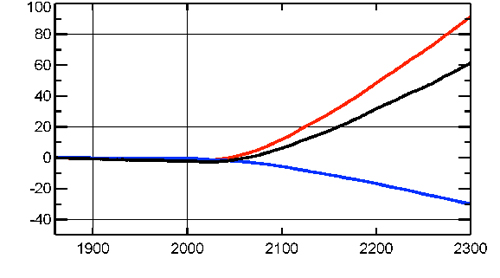
Fig 1 Change in sea level. Contribution from Greenland (red), from Antarctica (blue).Total contribution (black). ECHAM5 model, IPCC Scenario A1B, MPI, Hamburg
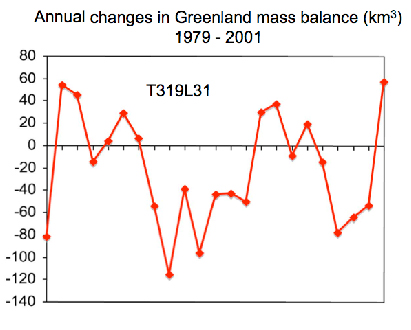
Fig 2 Annual mass balance for Greenland during 22 years. T319 equivalent to ca 30 km grid. Model driven by SST from a model run at lower resolution (T63). Fig3
http://www.issibern.ch/earthscience/documents/The%20Earth%20Cryosphere%20%20and%20sea%20level%20change%20Status%208%20.pdfWe must not forget the cyclic as the last diagram from Greenland shows.