The ice retreats 2013-01-25

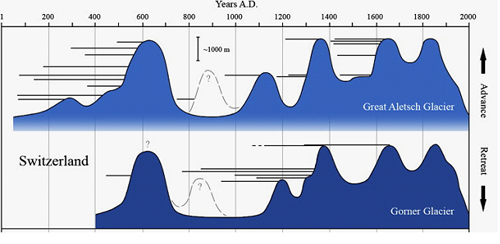
Diagramsource: http://www.sciencedirect.com/science/article/pii/S0277379108001479
Upside in the diagram shows how glaciers advance, down how they retreat. Horizontal lines show trees in the area killed by the ice and the line to the left shows tree-ring series.
We can see that around 600 century AD it was a severe cold spell which in the first part coincides with the Migration Period from around year 375 to about year 600. Little Ice Age lasted from the 1300s to the end of the 1800s broadly. What happened during the 1900s are not so apparent in this chart so we decide to take one more chart.

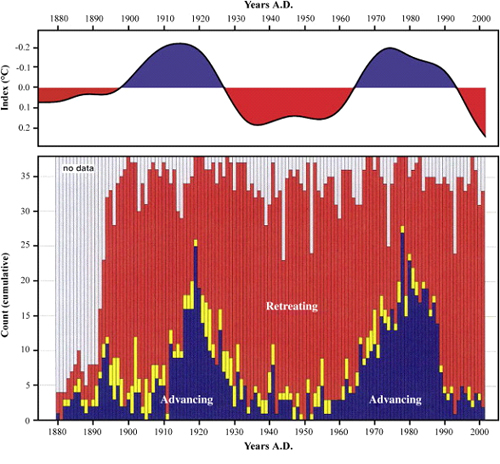
At the top of this chart, we see something called the Atlantic Multidecadal Oscillation, AMO. It is a measurement of the thermal fluctuations in the Atlantic waters measured from the equator to 60 degrees north latitude. It is a compilation of temperature average deviations around a normal. It was slightly cooler during two periods in the 1900s. This is compared with 38 glaciers in Switzerland and how they have moved.
Around 1920 it was about 25 glaciers which advanced (blue color), someone was stationary (yellow color) and 12 retreated (red color). There are not always good data, especially in the 1800s and that's when there are light markings. AMO's cold spells are reflected in the Swiss glaciers advance.
We'll say, it's lucky that the Little Ice Age got such abrupt end in the late 1800's and early 1900's. We got a better world in several ways. I just read Herman Lindqvist's book about Jean Bernadotte and it tells about some years at the time of the French Revolution when there were several long winter periods of 20 degrees below zero in France. We don´t have that today.